Truncating and censoring are completely different phenomena that can lead to incomplete samples. These phenomena occur in the medical sciences, engineering, social sciences, and other fields of research. If we ignore truncation and censoring, our population parameters are estimated to be inconsistent when we analyze the data.
Truncation and censoring will occur in the process of processing the sample, then we start by defining left truncation and left censoring:
When an individual below the threshold does not exist in the sample, our data is left truncated. For example, we want to study the size of some fish, using the fishing net as a sample, the fish is smaller than the fish net, so it does not exist in our sample.
Our data is censored from K, if each individual value exists in the sample and is below K, but the actual value is unknown. For example, we have a measuring instrument that does not detect a value below a certain level.
We mainly discuss left truncation and left censoring, but the concepts we discuss can be applied to all truncation and censoring: right truncation, right censoring, and interval.
When performing an estimate of truncated or censored data, we need to use some tools to illustrate these incomplete data. For truncated linear regression, we can use the truncreg command; for censored linear regression, we can use the intreg and tobit commands.
In this article, we will analyze the characteristics of truncated data and censored data, and discuss the use of the truncreg command and the tobit command to illustrate incomplete data.
Truncating data
Case: Royal Marines
Fogel et al. (1978) released a dataset of the height of the Royal Marines, which can be extended to two centuries. It can be used to determine the average height of a British male at different times. Trussell and Bloom (1979) pointed out that the sample was cut off due to the minimum height of the recruits. The data was truncated (rather than censored) because individuals who were below the minimum limit did not appear in the sample. Taking into account this fact, they fitted the truncated distribution of the height of the Royal Marines from 1800 to 1809.
Due to the problems mentioned by Trussell and Bloom, we used manual data sets. We assume that the population data follows the normal distribution μ=65 and σ=3.5, and both are left truncated to 64.
We use a histogram to summarize our data:
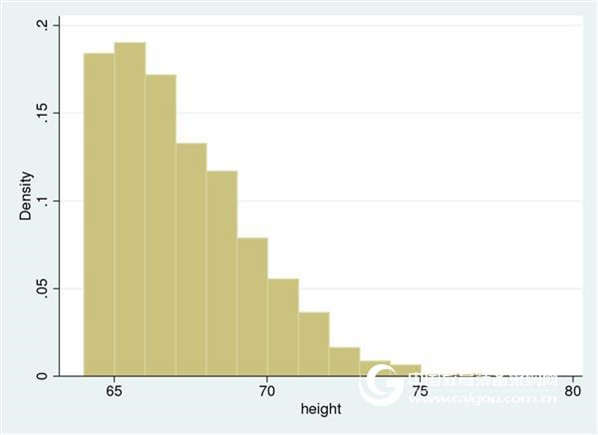
You can see the truncation point, there is no data less than 64.
What happens if we ignore truncation?
If we ignore truncation, the incomplete data is considered complete, and the sample mean and the population mean are inconsistent because all observations below the truncation point are missing. In our example, the true mean of 95% is outside the confidence interval predicted mean.
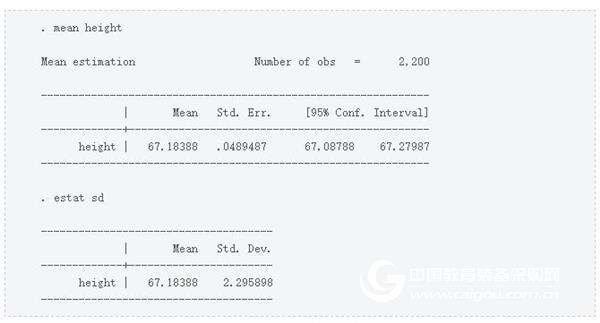
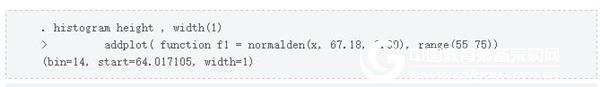
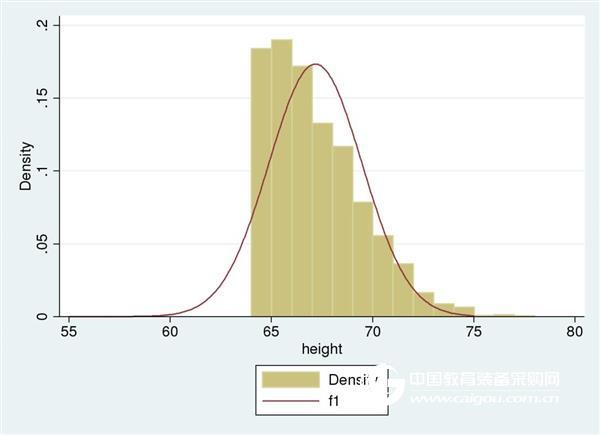
We can compare the sample histogram with the normal distribution obtained after ignoring the truncation and treat these values ​​as estimates of population mean and standard deviation.
Use truncreg to consider truncation
We can use truncreg to estimate the parameters of a potential non-truncated distribution. Consider the left truncation 64, which can be used with option ll(64).
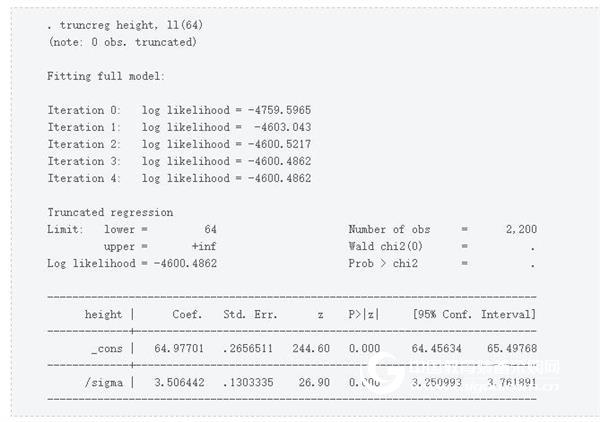
The estimated value is now close to our actual simulated value μ=65, σ=3.5.
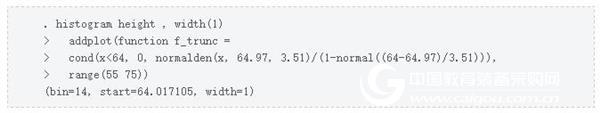
Let's overlay the truncation density into the data histogram.
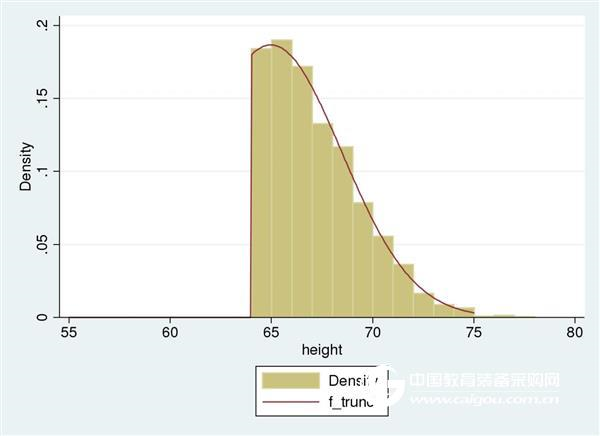
The truncated distribution is suitable for our sample. We analyze the population distribution mean equal to 65 and the standard deviation is equal to 3.5.
Censored data
Now let's take a look at the case of censored data and see the difference between them and the truncated data.
Case: Content of nicotine on the surface of the family
Matt et al. conducted a study in 2004 to evaluate the entire surface of tobacco smoke-contaminated smokers' families. A very interesting measure is the nicotine content of the furniture surface. Wipe samples from each household come from each piece of furniture. However, if the nicotine contamination is below a certain limit, the meter will not detect it.
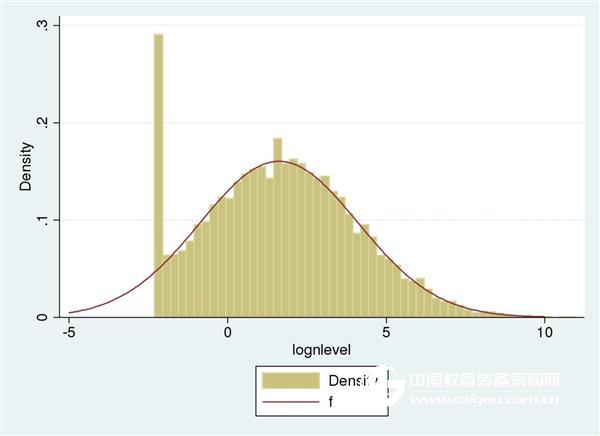
The data was censored instead of being truncated. When the nicotine contamination is below the detection limit, the sample still contains the detected value of nicotine, which is equal to the lowest limit. Inspired by this problem in this study, I created a manual data set at will. A log of nicotine contamination levels is assumed to be normal. Here, lognlevel contains the nicotine content. For the parameters used to simulate the log nicotine content, the censored data is μ = ln (5), σ = 2.5, and the left censored data is 0.1. We started to draw a histogram.
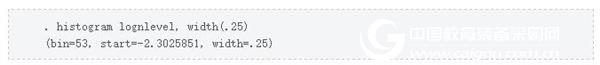
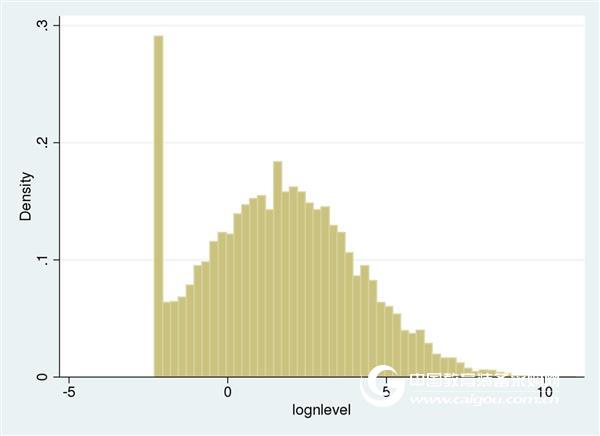
There is a spike on the left side of the histogram because the value below the detection limit is recorded as equal to the limit. Calculating the raw mean and standard deviation of the sample will not provide an appropriate estimate of the potential uncensored Gaussian distribution.
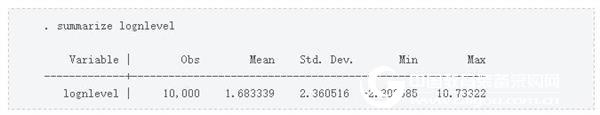
The mean and standard deviation are estimated to be 1.68 and 2.4, respectively, while the actual parameters are ln(5) = 1.61 and 2.5.
Use Tobit account review
We estimate the mean and standard deviation distribution and use the tobit of the ll option to consider the left censored value (if the audit limit varies with the observation, then intreg can be used instead).
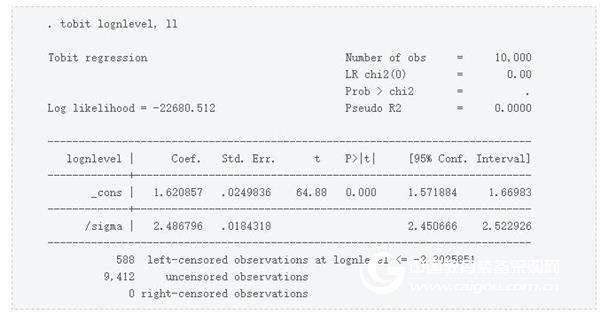
The average unanticipated distribution estimate has a mean of 1.62 and a standard deviation of 2.49. We superimpose the unaudited distribution into the histogram:
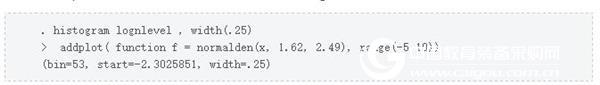
The potential unaudited distribution matches a portion of the histogram, and the left tail compensates for the spike in the review point.
to sum up
In the sampled data, censoring and truncation are two different phenomena. The potential population parameters in the truncated Gaussian sample can be estimated using truncreg. Potential population parameters in censored Gaussian samples are estimated using intreg or tobit.
Conclusion
We have already discussed the concepts of censoring and truncation, and also illustrated the meaning of these two concepts. The main points related to this discussion are as follows:
This discussion is based on the Gaussian model, but the main concepts can be extended to arbitrary distributions. The above example fits the regression model without covariates, so we can better visualize the shape of the censored and truncated distributions. However, these concepts are easily extended to the regression framework of covariates, and the expected value of a particular observation is a covariate function.
We have already discussed using truncreg and tobit to handle censored and truncated data. However, these commands can also be applied to non-crunched and non-truncated data as long as the data is a population sample in a particular distribution.
We believe that every child deserves to be the best version of themselves, and that the key foundation for brain development is built in their early years through curiosity about their environment. Don't you just love the "why" question?
That's why our mission is to provide high-quality and innovative resources that inspire educators to create engaging environments that stimulate children's curiosity, creativity and imagination. Many of our resources are open-ended, natural and fun, waiting for kids to bring them to life!
Music Doodle Board,Drawing Doodle Board,Lcd Doodle Board,Doodle Drawing Board,Childrens Magnetic Drawing Board
Guangdong Jishengke Industrial Co.,Ltd , https://www.dgjskpad.com